.svg)


June 25, 2026
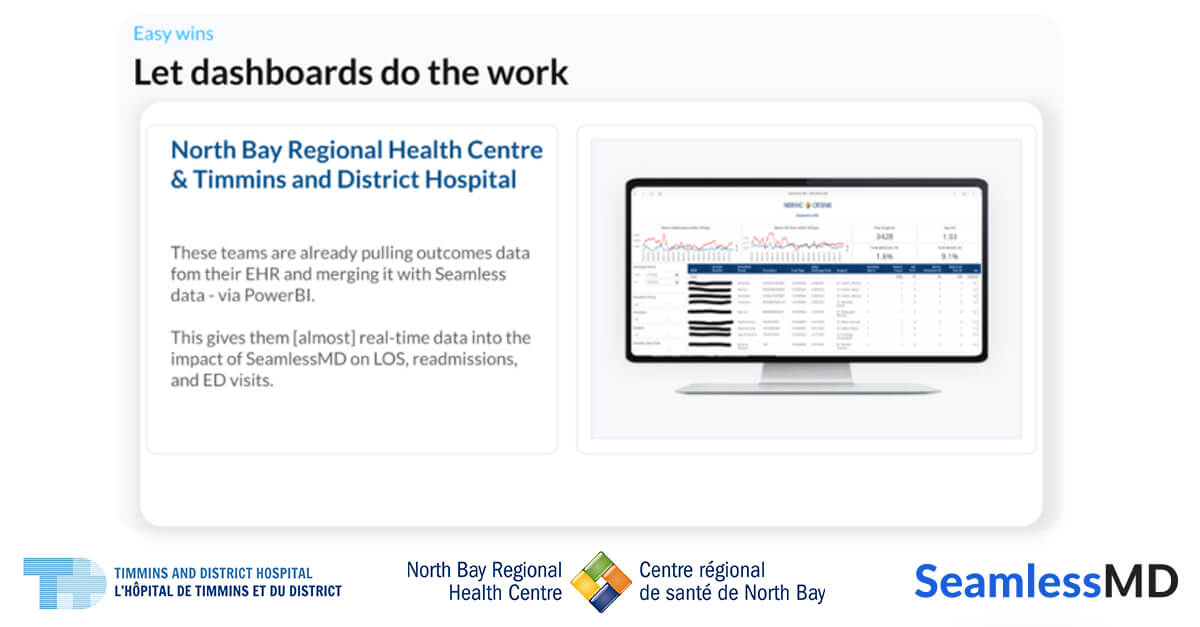
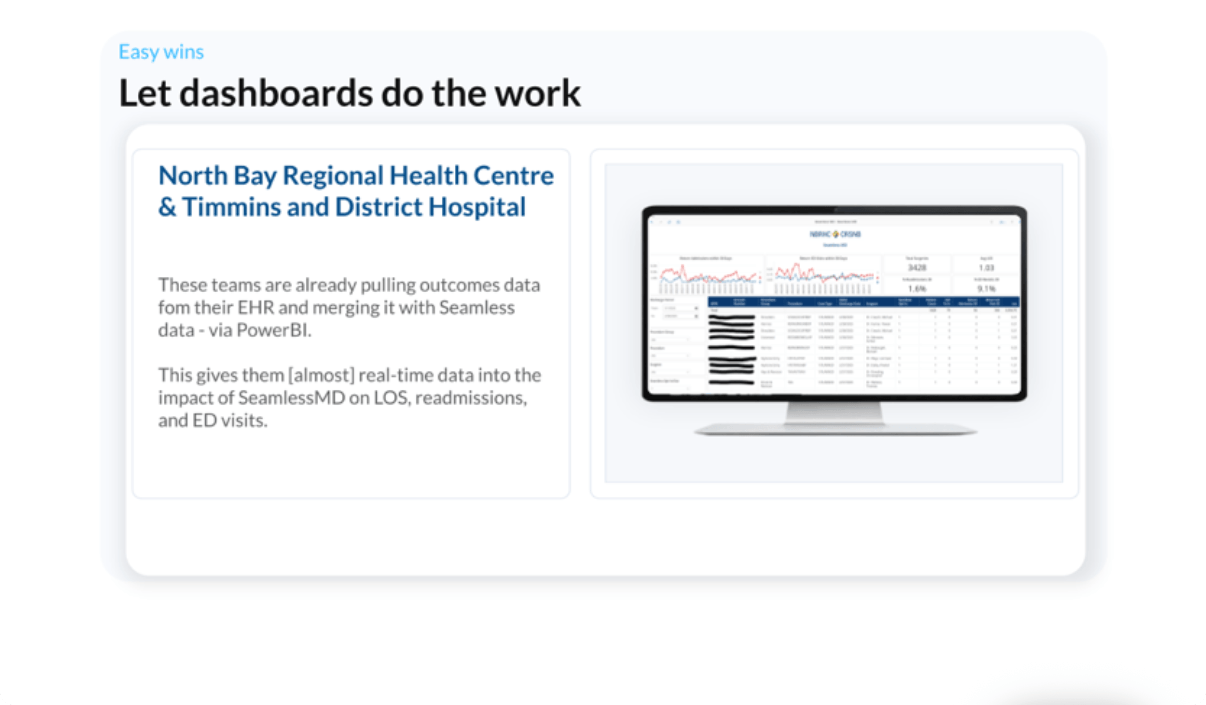
We are excited to highlight an innovation that doesn’t get talked about enough in digital health: not just delivering a great patient program, but building the infrastructure to prove it’s working. The teams at North Bay Regional Health Centre (NBRHC) and Timmins and District Hospital (TADH) have done exactly that — creating a Power BI dashboard that merges EHR outcomes data with SeamlessMD enrollment data to generate near real-time insight into the impact of their digital care programs.
The Challenge: Knowing It’s Working Isn’t Enough — You Need to Show It
For health systems investing in digital patient engagement, one of the most common gaps isn’t adoption — it’s measurement. Programs launch, patients enroll, and care teams feel the difference. But without a structured way to compare outcomes between patients on the platform and those who aren’t, it’s difficult to quantify the value, make the case for expansion, or identify where the program needs to improve.
That was the gap NBRHC and TADH set out to close.
The Innovation: Merging EHR and SeamlessMD Data in Power BI
The two teams built a custom Power BI dashboard that pulls outcomes data directly from their EHR — readmissions, ED visits, and length of stay — and merges it with a monthly upload of their SeamlessMD patient list. The result is a clear, ongoing comparison between patients who used SeamlessMD and those who didn’t, broken down by care plan.
1. SeamlessMD vs. Non-SeamlessMD Outcomes by Care Plan
By segmenting outcomes data into SeamlessMD and non-SeamlessMD cohorts, the dashboard gives clinical and operational leaders a direct view of how the platform is performing — not as a one-time study, but as a living measurement that updates month over month.
2. Near Real-Time Visibility into LOS, Readmissions, and ED Visits
The dashboard tracks the three metrics that matter most to hospital operations: length of stay, readmission rates, and emergency department visits. Leaders can see trends over time, spot anomalies, and connect changes in program engagement to changes in patient outcomes.
3. A Tool for Identifying and Solving Problem Areas
Beyond proving value, the dashboard has become a quality improvement tool. When the data surfaces an area of concern — such as unexpectedly high ED visit rates for a particular patient cohort — the teams can investigate, adjust the care plan, and track whether the change makes a difference. It closes the loop between program delivery and continuous improvement.
The Results: Outcomes That Speak for Themselves
The investment in measurement infrastructure has paid off in more ways than one. The most recent outcomes data from North Bay shows:
- 69% decrease in readmissions
- 25% decrease in ED visits
- 82% decrease in length of stay
These aren’t just impressive numbers — they’re credible ones, generated by a methodology the teams built themselves and can stand behind.
"From a remote patient monitoring perspective, having this dashboard has been a turning point. We have always seen the clinical impact in practice, but now we can clearly demonstrate it with real data. It has provided proof of concept and strengthened confidence across teams, from frontline staff to leadership, that these digital care programs are making a measurable difference. That visibility has been key to building momentum and stakeholder buy in for continued expansion.”
— NBRHC SeamlessMD Monitoring Team
"The dashboard not only helps us track outcomes in real time, but also gives us the opportunity to celebrate successes and identify areas where improvements may be needed. It allows us to see how changes within the hospital, such as revised discharge processes or other initiatives, can have a direct impact on the patient experience and outcomes."
— Cattabry Hebert, Manager, Perioperative Services at Timmins and District Hospital/L'Hôpital de Timmins et du district
A Look Ahead
What NBRHC and TADH have built is a model for how any health system can move from anecdotal confidence in a digital health tool to evidence-based accountability. The approach isn’t technically complex — it requires a monthly patient list upload and a Power BI environment most hospitals already have — but the discipline and intention behind it sets these teams apart.
As digital health programs proliferate across the sector, the ability to measure their impact on an ongoing basis will become a defining capability. NBRHC and TADH are already there.
We’re proud to support both teams — and grateful they’ve shown the rest of the community what it looks like to take outcomes measurement seriously.


.png)
